Master Futures And Options: How to Read Charts and Analyze Like a Pro in 2025

A Comprehensive Guide to Analyzing Futures and Options Charts
This guide’s goal is to help you break down complex technical indicators, market patterns and key components in an easy manner. Understanding how to read futures and options charts greatly impacts one’s ability to analyze market trends. So, let’s dive in!
Contents
- Understanding Chart Components
- Types of Charts
- Key Technical Indicators
- Volume and Open Interest
- Trend Analysis and Pattern Recognition
- Conclusion
Understanding Chart Components
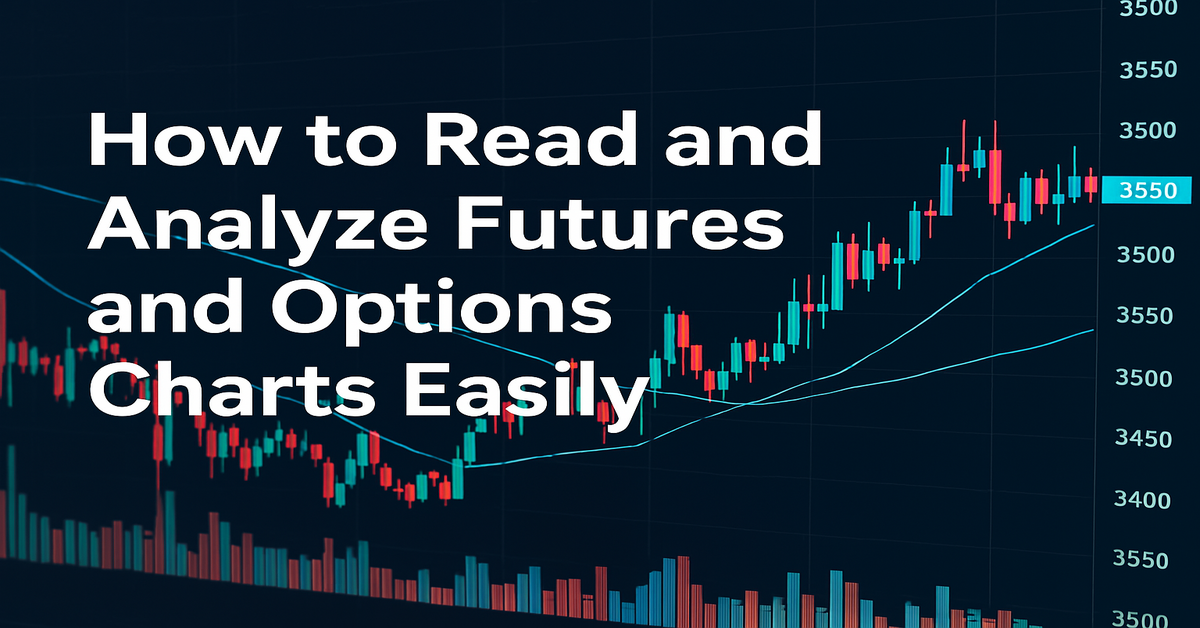
Before diving into a futures or options chart, it is important to capture its basic features. A chart represents a time period that has various price movements. The key components are:
- Price Axis – This is the Vertical Axis and it shows various price levels.
- Time Axis – This is the horizontal side and displays the time periods (minutes, hours, days).
- Volume Bars – These are positioned below the price chart which represents the number of contracts traded.
- Candlestick or Bar Charts – These represent opening, closing, high and low prices.
Traders can make better decisions about price movements if they understand the above chart elements.
Types of Charts
Different charts are used to illustrate market movements. The most common ones are:
- Candlestick Charts – Candlestick charts are well known because they are extremely useful in providing insight into the market.
- Bar Charts: Like candlestick charts, they illustrate the open, high, low, and close prices, just in a different way.
- Line Charts: They track long-term changes by displaying the closing prices of a company over a set period of time.
All these have pros and cons, which is why each different trader decides on one according to their specific trading strategies.
Key Technical Indicators
Traders use a variety of indicators to study a particular asset’s price movements and estimate its future price direction. A few examples include:
- Moving Averages: They smoothen underlying price volatility to highlight directions in which the price has moved over a given period.
- Relative Strength Index (RSI): This indicator indicates how much an asset’s price has changed due to buying or selling pressure and whether the asset is overbought or oversold.
- MACD (Moving Average Convergence Divergence): It compares two moving averages to help identify when an asset’s price is likely to change direction or reverse trend.
- Bollinger Bands: They show how volatile the market is and where potential breakout points may be located.
These indicators help traders make objective and well-informed choices.
Volume and Open Interest
In options and futures contracts two of the main measures are volume and open interest:
- Volume: the amount of contracts that have been traded in a given timeframe.
- Open Interest: It quantifies all the unsatisfied processes related to existing contracts.
Why are they important?
- The higher the volume while the price is changing, the stronger that movement is.
- Rising prices with increasing open interest is an indicator of strong trends.
- A drop in open interest may signal a possible reversal in the trend.
Keeping track of these indicators helps traders see how active the market is and what the market’s mood is.
Trend Analysis and Pattern Recognition
Although no price movement can be predicted with absolute certainty, chart patterns are useful as they utilize past price actions to project possible future price movements. Some common patterns included are:
- Support and Resistance Levels: These are horizontal lines on a chart that show the levels where reversals of price movements typically occur.
- Trendlines: Lines drawn in the direction of an identified trend connecting the highs, or the lows of one or multiple price movements.
- Chart Patterns: Indications of directional market movements which include forms such as head & shoulders, triangles, flags and other recognizable patterns.
Accuracy in trading improves when these patterns are applied with technical indicators.
Also Read: Master Fundamental Analysis: Unveiling the Art of Smart Investing
Conclusion
Understanding chart readings for futures and options is fundamental for any form of market analysis. During trades, knowledge of chart and technical indicators, volume, and patterns is essential to make the right calls. Keep practicing and leveraging these tools to become more effective at trading.
FAQs
1. Can I analyze charts on mobile apps?
Yes, a considerable number of mobile applications offer chart analysis in real-time.
2. How does the time frame affect chart analysis?
The majority of short-term traders are interested in minute or hour timeframes, while long-term investors use daily or weekly timeframes.
3. Are there free tools for learning chart analysis?
Yes, there are many tools offered online that are free and offer courses on chart reading and technical analysis.

