
MACD Trading Strategy:
Trading Strategy
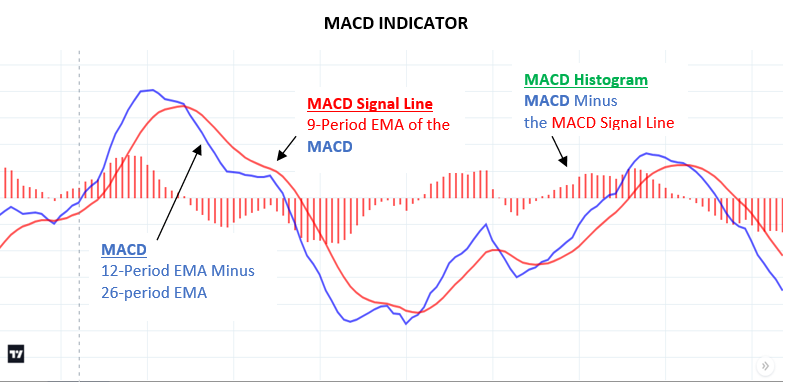
The Moving Average Convergence Divergence (MACD) is a popular momentum indicator that traders use to identify potential trend reversals, confirm trends, and generate buy or sell signals. It consists of two main components: the MACD line and the Signal line. Additionally, the MACD histogram is often used to visualize the difference between the two lines.
Here’s a simple MACD trading strategy along with an explanation using a chart pattern:
Indicators Used:
- MACD Line (Blue): This represents a short-term exponential moving average (EMA) and a longer-term EMA.
- Signal Line (Orange): A 9-day EMA of the MACD line.
- MACD Histogram: Represents the difference between the MACD and Signal lines.

Strategy:
- Buy Signal: When the MACD line crosses above the Signal line.
- Sell Signal: When the MACD line crosses below the Signal line.
Buy Signal:
The MACD line (blue) crosses above the Signal line (orange).
The MACD histogram (bars) moves from negative to positive.
In this example, a buy signal is generated when the MACD line crosses above the Signal line, and the MACD histogram turns positive.

Sell Signal:
The MACD line (blue) crosses below the Signal line (orange).
The MACD histogram (bars) moves from positive to negative.
In this case, a sell signal is generated when the MACD line crosses below the Signal line, and the MACD histogram turns negative.

Stop Loss:
Keep stop loss and target ratio minimum 1:2
Target:
Book profit either 1:2 or wait for the next reverse cross-over.